


Q1 2025 saw a broad market pullback driven by BTC and ETH underperformance, fading ETF momentum, and ongoing regulatory overhang. Liquidity also thinned as retail interest cooled, with volume peaking early in the quarter before steadily tapering off—mirroring the loss in market confidence.

The CMC Fear & Greed Index has reflected deep market unease throughout Q1, with a strong bias toward Fear and Extreme Fear.
Open Live Chart• Early March: Sentiment fell sharply into Extreme Fear territory, bottoming at 15, even as Bitcoin approached local highs above $84K.
• Mid-to-Late March: While Bitcoin price and volume showed some resilience, sentiment barely recovered—hovering around 21–33, still within Fear.
• The market failed to break into Neutral or Greed zones at any point during Q1, despite ETF inflows and high BTC dominance.

• Divergence Between Price & Sentiment: Bitcoin price held relatively strong above $78K–$80K, but sentiment was disproportionately negative—indicating traders lacked confidence and likely expected a reversal or correction.
• Volatility and Uncertainty Took Over: Sentiment was likely weighed down by high volatility (BTC vol at 51.88, ETH vol at 68.30), tightening liquidity, and fading altcoin interest.
• Extreme Fear as an Accumulation Zone? Historically, Extreme Fear has often signaled accumulation opportunities. The March 11 low may represent such a moment in hindsight if macro sentiment improves.
Q1 2025 was fear-driven despite BTC’s relative strength. With the Fear & Greed Index stuck below 40 all quarter, investor confidence remains shaky. Unless macro or regulatory catalysts reverse this psychological drag, capital rotation into risk assets like altcoins may remain limited heading into Q2.
Q1 closed with the CMC Altcoin Season Index at just 18, deep in “Bitcoin Season” territory. The index remained consistently below 25 throughout March, and even hit a yearly low of 17 on March 12. This trend shows a strong market preference for Bitcoin, while altcoins broadly underperformed amid rising risk aversion and macro uncertainty.
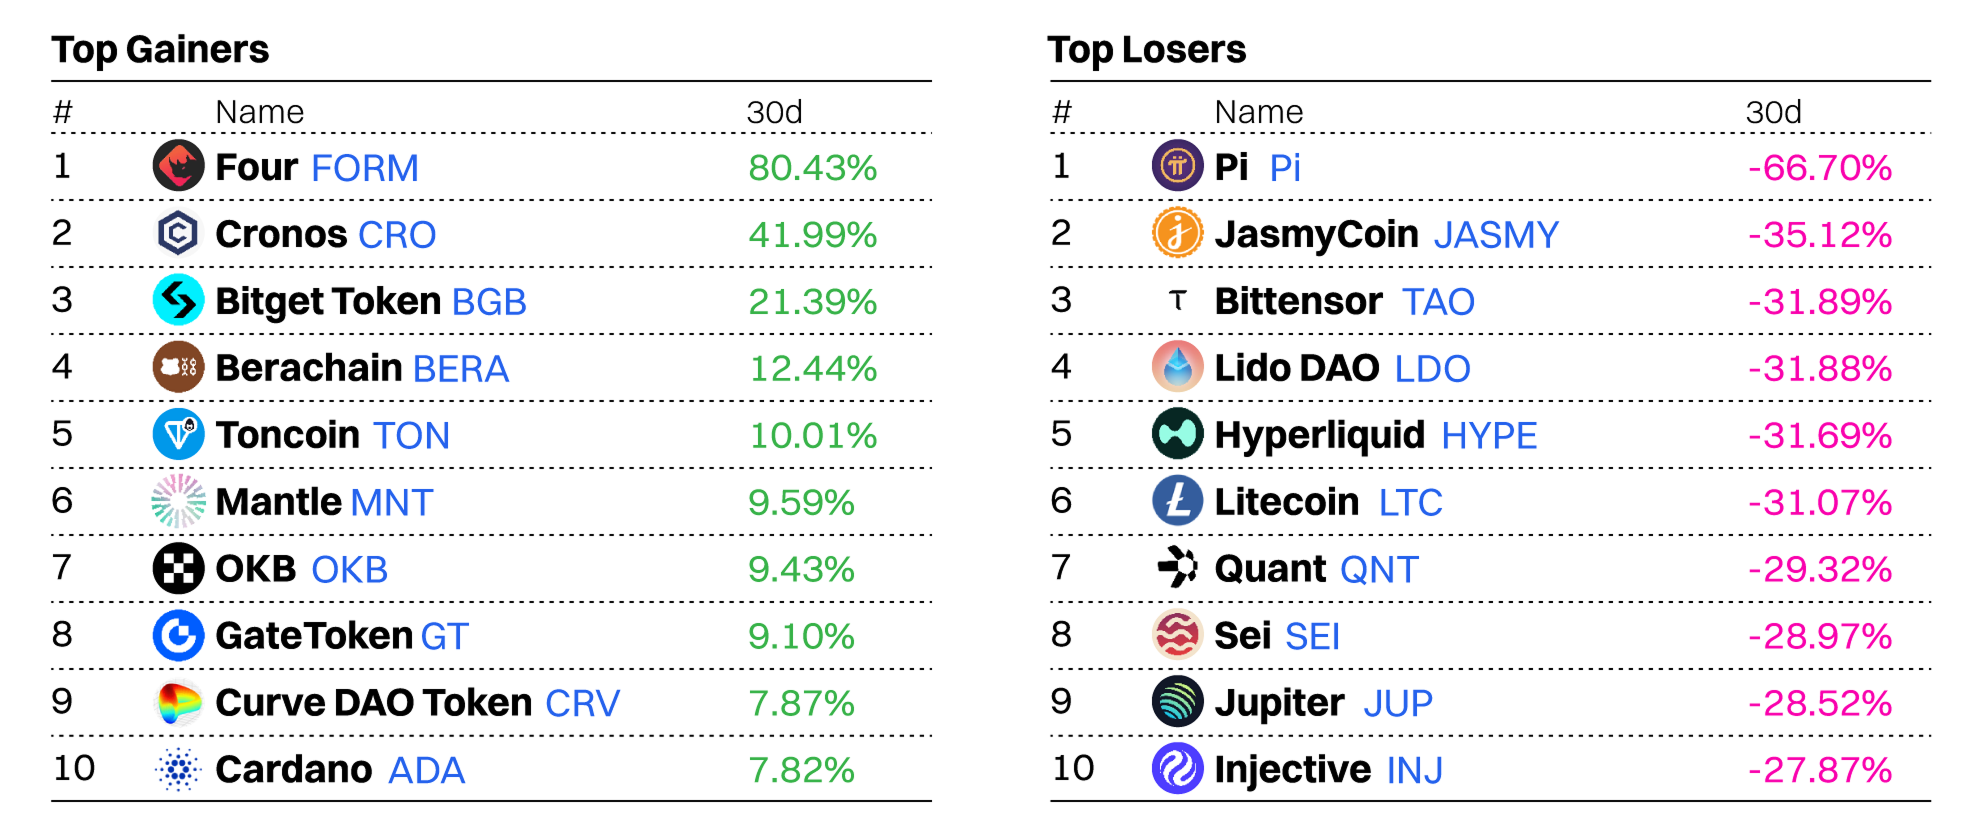
The “Top 100 Coins Over 90 Days” chart supports this. Only a handful of altcoins posted strong gains — with BERA (+745.98%), FORM (+447.06%), and PIP (+89.20%) as rare outliers. The majority of altcoins are down double digits: SOL (-31.55%), LINK (-34.71%), and TON (-30.09%) reflect just how brutal this cycle has been for large-cap alts. Even traditionally resilient tokens like ETH (-6.02%) and BNB (-14.64%) struggled to maintain footing.

While Bitcoin dominance remains high at 61%, the Altcoin Season Index shows a slight uptick from its March low, suggesting early-stage capital rotation could be starting. With many altcoins heavily oversold and BTC nearing psychological resistance above $85K, any stall or consolidation in BTC could prompt traders to rotate into beaten-down alts.
However, for a real “Altcoin Season” to ignite in Q2, two conditions must be met: 1) Stabilization in BTC price (no sharp drawdowns), and 2) A macro or regulatory catalyst (e.g., Ethereum spot ETF approval or L2 scaling wins). Watch for rising altcoin market cap relative to Bitcoin and a sustained move in the ASI above 25 as leading indicators.

Bitcoin (BTC) ended Q1 2025 down -10.52%, breaking its streak of strong Q1 performances in both 2023 (+71.77%) and 2024 (+68.68%). Despite a strong January (+9.29%), February’s sharp drop (-17.39%) erased those gains, and March failed to recover momentum. This pullback signals growing caution in the market, driven by macro uncertainty, ETF saturation, and declining retail activity.
Ethereum (ETH) fared significantly worse, plunging -43.85% in Q1 — its steepest quarterly loss since 2018. The correction followed an overheated rally in late 2024, compounded by elevated volatility, the unfortunate Bybit hack, and a lack of new growth narratives for ETH. This massive underperformance versus BTC again echoes the sharp drop in the Altcoin Season Index, and showcases why market capital rotated into BTC for relative safety.
BTC has historically shown moderate April returns (median: +5.04%), though May and June tend to be weaker. If Bitcoin maintains its current support above $80K, a Q2 breakout is possible — especially if macro conditions (e.g., interest rate cuts or stablecoin demand) improve. Watch ETF flows and volatility compression as early signs of a bullish breakout.
ETH, following its Q1 capitulation, may be setting up for a relief rally. Ethereum’s Q2 median return is +15.29%, and its underperformance could attract rotational inflows — especially if narratives around the ETH spot ETF or Layer-2 growth return. However, technicals and sentiment remain fragile, so any upside will require BTC stability as a base.

CoinMarketCap is the world’s most trafficked crypto website and the number one source of crypto data, insights, and community. By analyzing the viewing behavior of our millions of users, we can detect emerging trends and changing priorities within the global crypto community.
In this section, we unwrap our exclusive CMC data to cover:
• Most popular CMC categories
• Top coins per category
• CMC users around the world
• Most Popular Coins per Region
• Community Sentiment Check
From Hype to Fundamentals: Crypto Market Shifts Focus from Memecoins & AI to DeFi and Layer 1s
Early 2025 saw strong speculative activity (memecoins, AI, and hype-driven narratives), followed by a shift back toward infrastructure (BNB Chain, Solana, and DeFi) in late March. This could indicate that after periods of excitement, investors return to proven ecosystems as they look for sustainable opportunities.

• In early 2025 (W2, January 13-19), memecoins and Layer 1 projects saw a significant presence, suggesting heightened speculation and renewed interest in foundational blockchain networks.
• This aligns with periods of increased volatility, where traders often seek high-risk, high-reward opportunities.
• Around W5 (February 3-9), AI & Big Data saw an uptick in interest, likely fueled by broader AI-driven narratives in both tech and crypto.
• However, this enthusiasm appears to have waned slightly in subsequent weeks, indicating that AI’s dominance in crypto discussions is still intermittent rather than sustained.
• Solana’s ecosystem maintained a strong presence throughout, though its relative share fluctuated.
• The Ethereum ecosystem, driven by the Bybit ETH hack and the under-performance of $ETH, has attracted significant debate hence pageviews to the ecosystem.
• Despite discussions around Real World Assets (RWA) as a long-term crypto growth area, its share has remained below 5%, suggesting that institutional adoption is still developing.
• By W12 (March 24-30), we see a strong surge of the BNB Ecosystem (8.69%). Layer 1 (20.91%) solidified its dominance, indicating a possible shift toward more fundamental crypto infrastructure rather than short-term hype cycles.
• Memecoins (13.33%) remain strong, showing that speculative interest is still alive, but AI, Gaming, and RWA have struggled to capture significant sustained attention.

This chart highlights the Top 10 most viewed tokens within each trending sector on CoinMarketCap, offering a snapshot of where user interest is currently concentrated. One of the standout trends is that BNB Chain Ecosystem is experiencing a surge in retail interest, supported by a diverse mix of DeFi, infrastructure, and meme assets—positioning it as a growing narrative to watch closely. BNB itself leads the popularity, capturing 21.5% of total pageviews within the category, followed by meme-centric tokens like Mubarak (14.4%), FLOKI (10.1%), Cheems (8.4%), and Test (5.6%) are contributing to the ecosystem's visibility, suggesting a blend of utility and community-driven hype.

Between Q4 2024 and Q1 2025, the global distribution of crypto users has remained relatively stable, with the United States firmly holding the top spot at around 18.8%. However, India has closed the gap, rising from 8.27% to 9.84%, driven by the AI agent and Political Meme trend. The consistent presence of emerging markets like Brazil, Indonesia, Vietnam, and Turkey suggests that crypto remains an attractive financial alternative in countries with economic volatility. Overall, the Q1 trend shows a slight shift toward developing markets, reinforcing crypto’s role as a global, decentralized financial frontier.
• January 2025: Bitcoin led across most regions, with OFFICIAL TRUMP surging in North America and Asia. XRP, Solana, and Ethereum remained steady, while emerging tokens like Dogecoin saw regional traction.
• February 2025: Pi Network exploded in popularity—dominating views in Asia (37.7%) and Africa (43%). Bitcoin remained the global leader, especially in the Americas and Oceania. XRP and Solana continued strong across all regions.
• March 2025: OFFICIAL TRUMP made a comeback in Western markets, particularly North America and Oceania. Bitcoin retained the top spot globally. Pi held its lead in Asia and Africa, while XRP, Solana, and Ethereum remained core interests.
Projects like Celestia (TIA), Cosmos (ATOM), Gala (GALA), and Sui (SUI) are showing exceptionally strong bullish sentiment on CMC Community (above 89%), even though many are down 5–10% in price. This suggests the community sees these dips as buying opportunities, not weakness. Worldcoin (WLD) and Avalanche (AVAX) also stand out for high bullish confidence amid sharp declines.
OFFICIAL TRUMP continues to polarize the community—ranking #2 in most bearish sentiment (50.4%) and appearing again in daily bearish trending, suggesting fading hype or disillusionment. Meanwhile, CRV has the highest daily bearish trend (-17.2%), reflecting growing skepticism toward DeFi blue chips amid recent price action.
Tokens like Celestia, Cosmos, Gala, and TRON appear on both the "Most Bullish" and "Daily Bullish Trending" lists—indicating that not only is sentiment high, but it’s also rising fast, which may precede price reversals or narrative momentum.
• CMC Daily Bullish Trending page is a useful tool to track the tokens that are gaining bullish momentum quickly—watch for these as possible next narrative plays.
• The most recent daily trends are showing surprising strength in sentiment, hinting at community revival or renewed interest in tech-heavy projects.
Despite price dips, sentiment is heating up around modular chains (Celestia), layer 1s (SUI, AVAX), and community-led projects (Pi, Gala). Meanwhile, former hype tokens like OFFICIAL TRUMP and CRV are seeing rising bearish sentiment, suggesting a shift in retail focus back to fundamentals and long-term plays.

• The top 5 largest layer-1s by market capitalization are all down YTD, with ETH suffering the worst drawdown at 48.4%.
• BNB held up particularly well, suffering a minor decline of just 13%. This may be partially explained by the recent success of meme coins on the chain, with several high-profile launches in Q1 alone. This includes Tutorial (TUT) and CZ's Dog (BROCCOLI). The rollout of a $100 million liquidity incentive program and recent Pascal Hard Fork boosted confidence in the chain.
• Despite weak prevailing market conditions, TRX also showed strength. Zero-fee stablecoin transactions were enabled on the chain, as its leadership sought to gain market share from Ethereum. With growing on-chain DeFi revenue as well as a token agnostic fee payment upgrade and zero transaction fee memecoins transactions scheduled for 2025, Tron has largely resisted the downtrend.
• Cardano failed to maintain its momentum after benefitting from a wave of excitement around plans to include the native ADA asset in the United States Digital Asset stockpile — dropping 33.3%. Solana slipped after a large token unlock and a significantly declining memecoin trading volume fueled a precipitous decline in price, falling 36.1% YTD.
• Ethereum was marred by several adverse events in Q1 2025, including the theft of approximately $1.5 billion in ETH and Ethereum-based tokens from the cryptocurrency exchange Bybit on February 21, which were largely laundered for Bitcoin (BTC). Moreover, ETF outflows from popular ETH ETFs accelerated in Q1, with several week-long net outflow periods observed. In total, at least $240 million in ETH was withdrawn from ETH ETFs in Q1. Ethereum’s long-awaited Pectra update was also postponed due to readiness concerns — it is now slated to deploy to mainnet on April 30, 2025.

• Many smaller L1s saw their on-chain activity fall throughout Q1 2025, starting the year strong before suffering a decline from February onward.
• In terms of absolute active daily addresses, BNB Chain started the year strong and led the competition but gradually lost ground to Solana — being flipped in late March. The decline in Solana-based memecoin speculation, as well as a brief outage in February, likely precipitated the decline. The upcoming Firedancer upgrade remains eagerly anticipated by users.
• BNB Chain did experience a transient spike in on-chain activity in February, spiking on the days surrounding the release of the BNB Chain 2025 Tech Roadmap and Pascal upgrade.
• Bitcoin, TRON and Ethereum managed to resist the downtrend to grow their active addresses YTD. Tron led this growth with a 19% increase YTD, followed by Ethereum’s 3.1% and finally, Bitcoin’s 2.2%, despite all three assets declining in value over the same period.
• TON saw its on-chain active addresses decline by more than 50%, falling from 280k to 120k as most Telegram mini-apps shed users and the hype surrounding farming programs declined. Once the platform’s most popular mini-app, Hamster Kombat shed almost two-thirds of its active users YTD.
• That said, it’s important to note that one address does not necessarily equal one user. Lower fee blockchains generally experience more on-chain bot activity and have more smart-contract controlled addresses, which can inflate the numbers somewhat.
• Solana continues to lead all other prominent L1s in terms of transaction counts by a large margin. That said, approximately 80% of these transactions are due to on-chain voting activity, whereas another large fraction is attributed to arbitrage bot activity.
• That said, Solana’s daily transaction counts did fall 9.4% YTD.
• In Q1, BNB Chain saw the highest uptick on daily transaction counts, gaining 37.1% as a result of increased memecoin trading activity. Tron was close behind with a 22% increase following recent stablecoin activity gains.
• Cardano saw the largest decline at 55.7%. Cardano now has by far the largest transaction count to market capitalization (mcap) ratio of any major L1, at 0.00000118.
• Notably, Ethereum saw its transaction counts swell by 10% as DeFi activity continues to drive activity on the chain.

• In Q1, all top 10 layer-2s by TVL suffered drawdowns, with BOB standing out for its resilience after losing just 5.4% of its TVL. This is partially attributed to the success of the decentralized money market Euler on the chain.
• Blast saw the most dramatic decline in its TVL — falling from $1.1 billion to just $348 million after a 68.4% decline. This was likely due to a post-airdrop sell-off and subsequent user exodus. The platform also saw increased competition for ETH and stablecoin yield, accelerating its decline.
• Despite a decline of 36.7%, Arbitrum maintained its position as the largest L2 by TVL, narrowly beating out Base (claiming second place), which weathered the storm relatively well in Q1 with a 28.6% TVL decline. Arbitrum's decline comes despite the February BoLD upgrade, which moves the platform closer to Stage 2 L2 status, while Base’s Coinbase Wrapped BTC (cbBTC) Integration helped it target new audiences.
• Optimism shed more than half of its TVL but maintains its position as the third-largest L2 by TVL. This, despite several newer L2s, including Ink and Unichain joining the Superchain.
• World Chain flipped Scroll to become the 8th largest L2, largely due to Scroll’s massive 63.4% TVL decline. This comes as interest in the L2 subsided after its ‘Session One’ airdrop program ended.
• Q1 saw many L2s make plans to achieve Stage 1+ status by integrating a complete and functional proof system, among other requirements.
%201.png)
• Base is the only L2 to consistently exceed Ethereum in active address count. Several new upgrades are currently in development for the L2, including Flashblocks and Appchains, which could help to further cement its position as the most popular L2.
• Base’s lead Jesse Pollak also hinted about the possibility of bringing a tokenized version of the Coinbase stock ($COIN) to the L2 network.
• Arbitrum is the only other L2 to transiently overtake the Ethereum L1 in daily active address count, with a notable spike in activity noted in early March — shortly after Robinhood listed the asset.
• Base saw the largest drawdown in active address counts, falling two-thirds to reach 1 million daily active addresses, whereas zkSync Era saw a 29.6% reduction in active address counts.
• Base is currently by far the most active L2 by daily active addresses, managing to maintain an uncontested lead through the entirety of Q1 2025.
• Despite claims that they are cannibalizing the Ethereum base layer, most major L2s have seen declining daily transaction counts YTD.
• Base saw its daily transactions fall from 13.4 million to 6.9 million in Q1 — equivalent to a 48.5% decline. In contrast, zkSync Era and Starknet fell by 30.4% and 26.2%, respectively.
• Arbitrum managed to grow its presence, improving from 1.3 million to 2 million transactions per day — closing the gap with Base with its 54% activity gain. Whereas Optimism performed even better with a 65% transaction count gain.
• Base retains a clear lead ahead of the competition, with daily transactions leveling out from mid-February onward.
• Base, Arbitrum and Optimism now consistently process more daily transactions than the Ethereum L1.

The total value locked (TVL) in DeFi protocols fell by more than 20% YTD — collapsing from $118 billion on January 01 down to $92.9 billion by the end of March.
Overall, DeFi TVL fell back to levels not seen since November 2024, indicating decreased faith in on-chain financial applications.

In Q3, Ethereum’s DeFi TVL market share fell by 4% as smaller players, including BNB Chain and Berachain, captured market share.
Despite growing stablecoin volume, Tron saw the largest decline in market share, falling from 6.2% to 5%, whereas the newly launched Berachain captured a 3.4% market share in under two months following its February launch. The platform grew in popularity due to its robust airdrop strategy and yield farming opportunities.
Bitcoin saw a notable increase in TVL, claiming a 5.8% market share, thanks to the growth of BTC liquid staking solutions like Lombard.

Lending is now the largest sector by TVL, with more than $38.9 billion locked in on-chain open lending platforms like Aave and Compound. Previously the number 1 ranked sector by TVL, Liquid Staking solutions now come in close second place, with $36 billion in TVL — dominated by major players like Lido, Jito and Rocketpool.
Most sectors saw their absolute TVL decrease YTD, with the Real World Assets (RWA) sector being a notable exception, growing its TVL thanks to the success of BlackRock's BUIDL product and Ethena's USDtb.


• Despite turbulent market conditions, the stablecoin sector continued to expand, growing its market capitalization by 8.6% in 2025 so far.
• The total market capitalization of all stablecoins from the top 10 issues now sits at $209.9 billion — briefly exceeding $210 billion at times.
• Tether maintained its position as the largest stablecoin issuer in 2025 but did see its market share decline from 72.4% to 67.3% as Circle’s USDC expanded from 19.8% to 23.4%.
• In 2025, several cryptocurrency exchanges delisted Tether (USDT) to comply with the European Union's Markets in Crypto-Assets (MiCA) regulation. Whereas USDC secured regulatory approvals, including licensing under the European Union's Markets in Crypto-Assets (MiCA) framework.
• Ethena also grew its stablecoin market share in Q1 2025 thanks to the success of USDtb—a stablecoin launched in December 2024, predominantly backed by BlackRock's BUIDL fund—bolstered by strategic partnerships and the launch of a Telegram-based payments app.
• In terms of the biggest quarterly change, Usual's USD0 saw the biggest decline, shrinking its supply by 46.7%. Paypal's PyUSD saw the biggest gain, more than doubling its supply in the last 3 months.
• Stablecoins continue to prop up on-chain activity on many chains, with users leveraging them for cross-border settlement, accessing DeFi yield, and trading on decentralized exchanges.
• Stablecoin transfer volumes continued to grow in Q1 2025 and hit an all-time high in January.
• Per data from Artemis, USDT and USDC remain the most transferred USD stablecoins when discounting MEV activity and intra-centralized exchange transfers.
• Daily stablecoin transfer volumes now regularly exceed $72 billion — more than doubling in a year.
• Ethereum remains the most popular chain for stablecoin issuance, with a 55.8% market dominance, which has remained essentially flat YTD.
• Meanwhile, Solana saw its stablecoin supply increase by 140% YTD, growing its market share from 2.7% to 5.5%. This is largely due to the expansion of USDC on the chain.
• The stablecoin supply on Tron reached an all-time high of $66.2 billion despite a dramatic reduction in the supply of USDD tokens.

• BlackRock’s USD Institutional Digital Liquidity Fund (BUIDL) is now the largest RWA protocol by a wide margin — surpassing $1.8 billion in TVL by the end of Q1.
• The second largest is Ethena’s USDtb — a dollar stablecoin also backed by BlackRock’s BUIDL.
• Several on-chain treasury issuers also saw their TVL increase in Q1, including Ondo Finance and Sky RWA. Ondo's USDY token and Sky RWA's USDS stablecoins are both backed by US Treasury debt and have seen their supplies hit all-time highs in Q1.
• The expansion of these platforms demonstrates the growing demand for low-risk yield-bearing instruments, including yield-bearing stablecoins.

• Despite a strong start to 2025, Virtuals Protocol gradually saw its weekly on-chain revenue collapse in Q1 — falling from a peak of $1.2m in January to under $30k/week throughout most of March.
• Its February expansion to Solana did little to improve revenue, signaling dramatically reduced interest in on-chain AI agents.
• Virtuals Protocol now generates ~$22,100 in 7-day revenue and has fallen out of the top 100 protocols by revenue generation.

• Top AI agent tokens saw their market capitalizations drop precipitously YTD, with pure-play AI agent platforms/tokens suffering the largest drawdowns.
• Among the top 10 largest AI agent tokens by market capitalization, ai16z and Virtuals Protocol shed more than 90% of their value in under 3 months.
• The average AI agent token lost more than 67% of its value YTD, compared to the CoinMarketCap 100 Index drawdown of 18.6%
.png)
.png)

As enthusiasm surrounding meme coins waned, Pump.fun has seen its revenue collapse. Following a strong start to the year, where the platform typically collected more than $3 million in fees per day, it gradually fell off to under $100k/day by the end of March 2025.
Despite revenue decreasing by ~98%, Pump.fun remains one of the most profitable Dapps — counting among the top 10 Dapps by weekly revenue.

Pump.fun hit an all-time peak of over 71,700 tokens launched on January 23, 2025. Since then, the number of new launches has declined somewhat, with an average of 26,400 tokens launched per day throughout March.
Though the number of launches remains high, the fraction that meet the graduation criteria has diminished considerably, falling from 1.1% to 0.64% YTD.
The success of Pump.fun also spawned the proliferation of numerous clones, including Raydium's LaunchLab which offers flexible bonding curves and PumpTires — a clone built for the Pulsechain ecosystem. Neither managed to emulate Pump.fun’s success.
The declining interest comes despite several major updates to the platform, including the launch of the PumpSwap DEX and plans to enable creator revenue sharing.


